http://ex-parrot.com/~chris/images/20050407/triangle.png
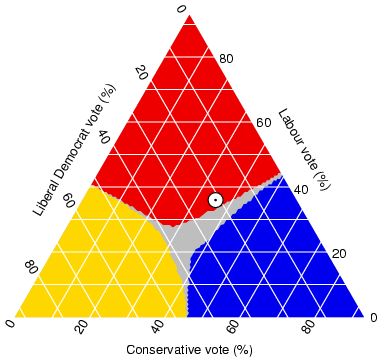
This is a Triangular Plot which shows three different variables and their data using a triangular shape. This plot shows the percentage of votes distributed between the Labour, Conservative, and Liberal Democratic parties in an election in the UK
Saturday, July 20, 2013
Index Value Plot
http://waterwatch.usgs.gov/regplots/real/real_or_2.gif
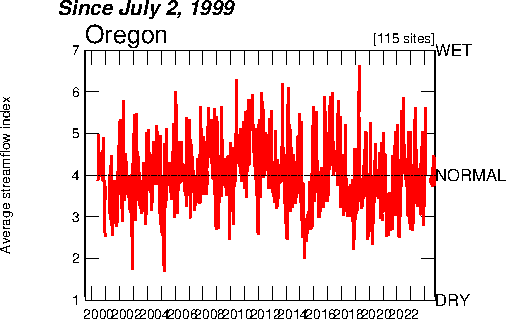
This is a Index Value Plot which takes the index value of a variable and plots it to see if there are any discrepancies. It also shows whether there was a positive or negative change in the index value. This plot shows the rainfall recorded in inches in Oregon from 1999 until 2006. Four inches is the normal rainfall for the area and is the base number.
Lorenz Curve
http://www.cuhk.edu.hk/soc/courses/ih/globalization/lect02/quantitative_skills/eng/gini_coefficient_eng.htm
This is a Lorenz curve which is a graph formed by showing the concentration of ownership of certain economic quantities. This map allows for one to analyze how much economic success one has made.
Bilateral graph
http://www.energytribune.com/974/green-energy-advocate-amory-lovins-guru-or-fakir
This is a bilateral graph which shows the correlation between two or more different sets of variables. This example is considered a bilateral graph because it is using two variables, energy use per capital and energy use per dollar GDP to determine energy use throughout the US.
Similarity Matrix
This is a similarity matrix which visualizes the strength of similarity between multiple variables. This is helpful when trying to determine which variable can be substituted for another. This similarity matrix shows the temporal similarity of a collection of 512 photos.
Correlation Matrix
http://www.livestockgenomics.csiro.au/Genome_to_Phenome/
This is a correlation matrix that shows a correlation between variables. It visualizes the strength correlation between multiple variables. This correlation matrix shows variables between tissues.
DOQQ Map
http://www.crwr.utexas.edu/gis/gishydro00/Class/trmproj/Donnelly/termproject.htm
This is a Digital Orthoquarter Quads which is developed from raster images from aerial photos. Depending upon the film used, they are presented in real or true color or false infrared color. This picture is a red colored DOQQ of a 500 year flood plain. This image could help planners prepare for the next major flood and prevent major catastrophe.
Isopach Maps
http://www.geoexpro.com/article/The_Only_Complete_Regional_Perspective/c3301c49.aspx
This is a Isopach map which shows the thickness of rock or land using contour lines. These are commonly used for resource excavation purposes such as coal, graphite, gold, etc. This specific map shows the thickness of the lower region of Texas into the Panhandle region. You can see the isopach lines as they nearer the east coast become thinner.
Cartographic Animations
http://www.jeffsweather.com/archives/Hurricane%20Dean%20Projeted%20Path.jpg
This is a Cartographic animations which are used to show how things will move and the time span that they will accomplish that movement. They are often used on weather and news channels to portray where a storm may be heading. In my example you can see the projected path of Hurricane Dean and how it will hit Cuba and possibly Texas.
Proportional Circle Map
http://www.creativeclass.com/_v3/creative_class/2009/08/
This is a proportional circle map which represents certain information in a certain area by using circles proportionate to the represented information. If the circles are small then the number of what ever is being measured is small. The map shows the bailout money that was allocated to each state. As you can see the bigger circles in the north east show large sums of money.
PLSS Map
http://gis.nwcg.gov/giss_2006/job_aids/maps_and_graphics/USA_PLSS_Meridians_map.jpg
This is a Public Land Survey Systems Map (PLSS) that subdivides land in a geographic area, similar to the cadastral map. It generally uses a series of rectangles to subdivide land to show which land is available. This map shows principal areas and base lines across the United States
Hyposomentric Map
http://www.reliefshading.com/colors/hypsometric.html
This is a hypsometric map that is a type of topographic map, similar to planimetric with the exception it includes elevation using contour lines. This map shows the elevations in a section of France and as you can see it is clearly visible.
Propaganda Map
http://historum.com/general-history/9905-propaganda-maps-2.html
This is a Propaganda Map of the United States made by the Historum department of Texas. These maps usually distort some aspect of the map to an extreme usually to prove a point or establish power. This map depicts the state of Texas overtaking the whole United States and the labels on the remaining states poke fun at each one.
Shadded Relief Map
http://www.learnnc.org/lp/multimedia/3292
This is a Shaded Relief map, which uses shades to show relief features of the terrain. In this map of Cambodia you can see the different mountain ranges and valleys following the shading key.
Isoline Map
http://www.scar.org/publications/reports/20/Images/Rep%2020%20a%2015%20pagesPCT17.JPG
This is an isoline map which uses lines to connect equal values or points of interest. In this map it shows the South Pole and has the longitudinal lines running vertically from it.
Thematic Map
http://geodepot.statcan.ca/Diss/Maps/ThematicMaps/population/National/pop_chg_3d_colour_e.jpg
This is a Thematic map which is supposed to show different themes for a particular area. These themes can range from social, economic, political, etc. In this map it shows Canada and the increases in terms of population change.
Planimetric Map
http://gis.ny.gov/mapssales/paper/pap_quad.htm?nysgis=
This is a planimetric map which is used to display horizontal information and exclude the vertical allowing for a strictly 2D viewing. These maps are useful for directions and seeing where things are oriented in a city. This map show the Lake George area in New york and as you can see it is very plain.
Digital Elevation Map
http://nsidc.org/data/docs/daac/nsidc0304_0305_glas_dems.gd.html
This is a Digital Elevation Map, these maps show the elevation of the terrain below using scanning technology. This DEM shows Antarctica's elevation using lighter and darker shading.
LIDAR
http://hodcivil.edublogs.org/2011/11/06/lidar-%E2%80%93-light-detection-and-ranging/
This is a LIDAR map which uses laser lights on the bottom of a plane to scan the surface and return information on the terrain below. This LIDAR depicts ground zero in Manhattan and you can see how it clearly changed the terrain of the area.
Mental Map
http://www.mind-mapping.co.uk/mind-maps-examples/business.htm
This is a mind map of someones reasoning behind innovation. The purpose of this is to illustrate what may be in your head so that you may have a clearer picture of the subject at hand. This person seems to have a very business oriented perspective on life compared to others
Subscribe to:
Posts (Atom)