http://www.colorado.edu/geography/extra/geogweb/bouldercreek-2/preview/page2.html
This is a climograph which is a representation of climate in a specific region, usually showing monthly average temperature and precipitation as in this case. This map shows the averages of Boulder, Colorado showing the months with high precipitation and areas of low rainfall.
Saturday, July 20, 2013
Windrose
This is a Windrose plot which is a graphic tool used by meteorologists to give a detailed interpretation of the direction and speed of the wind at a particular area. This map shows the wind in Olympia, Washington and shows how fast and direction using shading to represent wind speed.
Box Plot
http://www.stat.sc.edu/webstat/version2.0/graphics/Boxplot2.gif
This is a Box plot that is used to graphically depict a group of numerical data through their five-number summaries. As you can see in the plot it is easy to analyze the two numerical data sets and find their median.
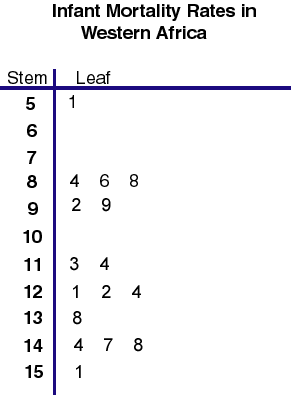
Stem and Leaf Plot
http://mainland.cctt.org/mathsummer/JosephBond/StemAndPlots/images/table2.gif
This is a Stem and Leaf plot that is used to present numerical data without having to using multiple integers. The data found on the left is considered the stem, while the other numbers are the leaves. This plot shows the infant mortality rates in Western Africa and can be seen that it is extremely high.
3D Parallel Coordinate Graph
http://vis.lbl.gov/Vignettes/Drosophila/3DParallelCoordinates.png
This is a Parallel Coordinate Graph that is used to display numerous amounts of datasets. As you can see this image has numerous data in it as each line is a different plot of data going through a 3D plane.
Doppler Radar
http://ktsnow.blogspot.com/2008/06/doppler-radar.html
This is a Doppler Radar image of Hurricane Andrew as it came ashore in south Florida. This type of imaging allows us to see significant weather before it affects us and allows us to accurately tell the weather. The image also uses a color shading scale to show areas of high and low rain.
Cartogram
http://www.cbr.washington.edu/papers/jim/draft.html
This is a cartogram that shows each state in United States rescaled to accurately depict population. The map is distorted so as to convey the information in a easier alternate method. This maps are extremely useful for manipulating the information into a more realistic approach.
Subscribe to:
Posts (Atom)